
- Introduction
- Industry background
- Benchmarking
- Ratio Analysis
- Profitability
- Profit Margins
- CAGR and YoY Growth
- Return on Investments
- Asset Utilization Ratios
- Liquidity Analysis
- Debt Utilization Ratios
- Degree of Combined Leverage (DCL)
- The Degree of Operating Leverage (DOL)
- Degree of Financial Leverage (DFL)
- Degree of Combined leverage
- Dividend Yield and P/E Ratio
- Profitability
- Limitations of Research
- Conclusion
- Works Cited
- Bibliography
- Appendices
- Appendix 1: Table of Figures
- Appendix 2: Financial Statements M&S
- Appendix 3: Financial Statements J Sainsbury
Abstract
This report presents a fundamental analysis for financial and investment risks in Marks and Spencer Group Plc, considering its chief competitor J. Sainsbury PLC as a benchmark for performance. A comprehensive ratio analysis is conducted amongst the companies, whilst some figures are contrasted with industry demographics, others are just analysed amongst the two companies; this report places greater emphasis on gearing and working capital ratios, and critically evaluates the performance and managerial expertise of both organizations.
Introduction
Marks and Spencer group PLC is the 5th largest retailer in the UK in terms of revenues (Retail Knowledge Bank, 2009), the group owns over 600 stores in the UK itself, and another 280 abroad under its brand name (Marks and Spencer PLC, 2010). The primary focus of the group is on its clothing range, and the group generates the largest revenues in terms of clothing sector in the UK, and is also the largest retailer of clothes in UK.
In the finance and commerce sectors the group is mostly known for its EBIT in 1997, which was more than £1 billion in the year, and which was a record for any retailer in the UK at that time. Although as of today the groups EBIT still stands strong at £870 million (2009 session ending), and in 2008 and 2007 the group’s EBIT was well over £1 Billion again.
The group’s profits took a plunge after the year 1999-2000 as it expanded its business demographics and sectors alike, when it introduced furniture and technology products as a part of its product range. Although the company’s executives proved their problem solving and change acceptance capabilities when instantly in the year 2001 the company had completely introduced a novel business model and changed its policies radically to regain most of its lost share of market, the company also sold its sinking financial services business in 2004.
But even as of today the massive blow that the company faced in the early years of this millennium is visible as the company continues to pay massive interests on debts incurred during the period and evidently it has lost a significant market share to its competitors like J Sainsbury and Next. Even though the company tried to fight its competitors, it continued to receive blows such as when Justin King left M&S for J Sainsbury and introduced a revolutionary CRM innovation code named ‘Making Sainsbury great again’. (BBC News, 2004)
Industry Background
As of the year ending 2009, clothing and textile stores held a market share of 13.4% amongst the total retail sector, and non-specialised food stores held a 40.8% of market share (Office for National Statistics: Newport, 2009: 1-2), which of course, was obvious as food is a FMCG commodity as well as a prime basic need. This also directly reflects that amongst the retail industry, the revenues of companies that sell FMCG goods through equivalent number and sizes of stores is bound to be higher, for example, the revenues of J Sainsbury PLC are almost twice than those of Marks and Spencer [Revenues of J Sainsbury for 2009 = £18.9 Billion (J Sainsbury, 2010); M&S = £9 Billion (Marks and Spencer Group Plc, 2010)]; Thus J Sainsbury holds an over 16% share of the market in the retail sector.
In January 2010 the retail industry broke a new 15 year low sales when it fell by 0.7% (Berwin, 2010); following this the retail sector is anxiously eying the next big blockbuster event for sales, the Valentines day; during which the retailers expect that revenues up to £1.6 billion would be generated for the industry. Even the retail companies that deal with groceries are hoping that the recent credit crunch would promote couples to dine at home rather than in cafes, bakeries or restaurants (Retail Week, 2010).
Benchmarking
J Sainsbury PLC, is a prominent retailer within the UK, and even though it’s prime focus of business is on sales of grocery items; but the business practices and management policies of Sainsbury and Marks and Spencer are quite equivalent and the competitiveness amongst both companies is visible to the general populace of UK. With almost 800 stores, J Sainsbury would be a perfect benchmark for the performance management of Marks and Spencer. Even the stock prices of both the companies tend to catch on to one another’s levels:
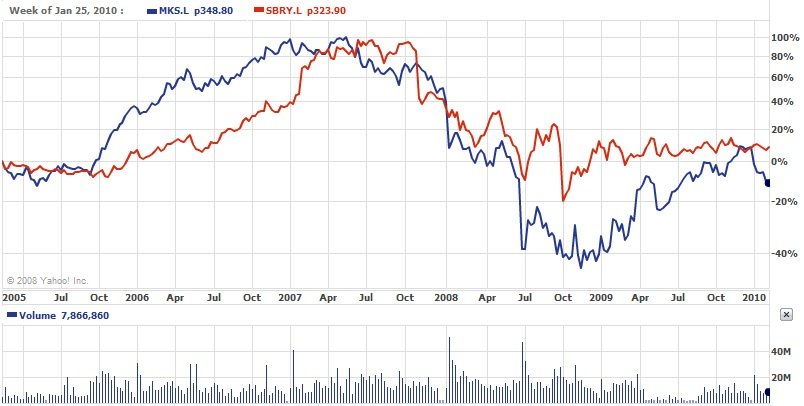
Figure 3: Stock Prices on London Stock Exchange [2005-current] (Yahoo! Finance, 2012)
Ratio Analysis
Profitability
Profit Margins
| Marks & Spencer Group PLC | 2009 | 2008 | 2007 | 2006 |
| Revenues | 9062.10 | 9022.00 | 8588.10 | 7797.70 |
| Gross Profit | 3371.90 | 3486.80 | 3341.20 | 2985.60 |
| Net Profit | 508.00 | 821.00 | 659.20 | 520.60 |
| Gross Profit Margin (Gross Profit / Revenues) * 100 | 37.21 % | 38.65 % | 38.90 % | 38.29 % |
| Net Profit Margins | 5.60 % | 9.10 % | 7.67 % | 6.68 % |
| 4 year average Net Profit Margin | 7.26 % | |||
Table 1: All amounts in £ Millions (except for percentage amounts); (Marks and Spencer Group Plc, 2010)
The difference amongst the profit margins (both gross and net) of both the companies under concern is quite significant. The difference amongst the gross profit alone is a colossal 700%, with the gross profit margins of Marks and Spencer to about 37.21% and the gross profit margins for Sainsbury are just 5.47%. A gross profit margin of 5% is considered second-rate for any company and any industry, as it is after gross profits the company deducts the marketing and administrative expenses to get an EBIT.
| J Sainsbury | 2009 | 2008 | 2007 | 2006 |
| Revenues | 18911.00 | 17837.00 | 17151.00 | 16061.00 |
| Gross Profit | 1036.00 | 1002.00 | 1172.00 | 1067.00 |
| Net Profit | 289.00 | 329.00 | 324.00 | 58.00 |
| Gross Profit Margin (Gross Profit / Revenues) * 100 | 5.47 % | 5.61 % | 6.83 % | 6.64 % |
| Net Profit Margins | 1.53 % | 1.84 % | 1.89 % | 0.36 % |
| 4 year average Net Profit Margin | 1.405 % | |||
Table 2: All amounts in £ Millions (except for percentage amounts); (J Sainsbury, 2010)
Even though the above stands true, that a GP margin of 5.5% is mediocre, and might even be considered a mistake if it were just mentioned without any supporting figures of revenues and cost of sales. But it is not, and after a careful analysis of the financial statements of the company, it was ascertained why the margins are so low, actually J Sainsbury PLC does not franchise its space, instead they operate on the traditional ‘buy more and cheaper’ routine, and therefore have significantly lesser marketing and selling expenses. The remaining costs of advertisements and other selling and staffing expenses have been placed within the cost of sales header under the Income Statement, and this accounting guideline (personal to the company) is the reason why the cost of sales of the company amount for 94.5% of its revenues; the actual cost of sales for the year 2009 of Sainsbury were £17.8 billion, while the revenues were £18.9 billion.
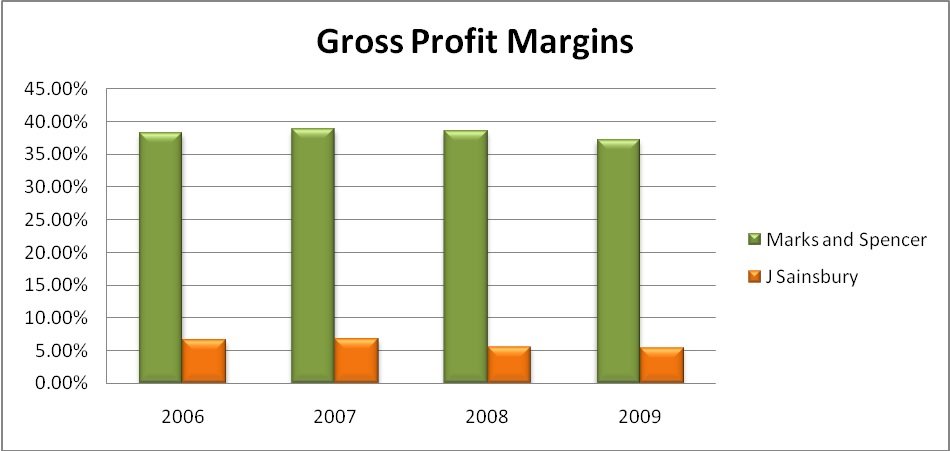
Figure 4: Gross Profit Margins
The gross profit margins of both these companies are quite synchronous in terms of growth and decline patterns. And therefore the operating policies don’t seem distinctive. But this still does not account for the distinctiveness amongst the net profit trend line…
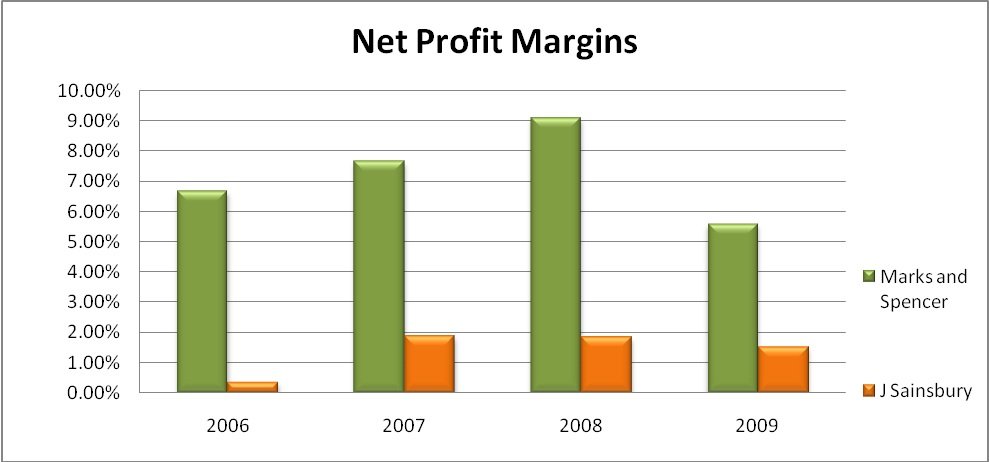
Figure 5: Net profit Margins

Figure 6: Net profits
Due to significant investment in some new policies and expansion plans, the net income of Sainsbury was quit lower in 2006, although, a similar fall is witnessed in the Net profits of Marks and Spencer in the year ending 2009; the company supposedly blames the recession and higher celebrity endorsement costs for the recent fall (Talking Retail weekly, 2008).
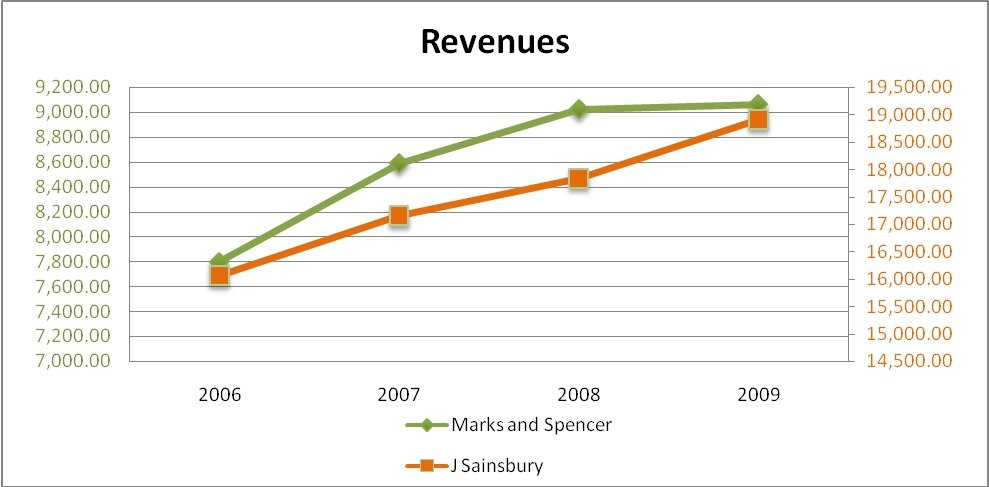
Figure 7: Revenues
A common trend amongst both companies, is the fact that the revenues of Sainsbury and M&S are increasing at a steady rate, and yet net and gross profits have significantly fallen in 2009, and therefore it may be assumed that this fall is likely due to an external factor like the markets or recession.
Other figures such as interest expenses and dividends seem in order, with Sainsbury spending more in these areas, but considering the mammoth turnover of the company, which is more than double than that of M&S, these would appear normal. Yet Sainsbury is paying a lot more taxes than M&K which hits its net profit margins hard; against the profit before tax of £706 million M&S paid taxes worth £199 million (2009), and against a profit before tax of just £466 J Sainsbury is paying taxes worth £177 million; which amounts up to 40% in taxes alone for Sainsbury (2009). (Marks and Spencer Group Plc, 2010) (J Sainsbury, 2010)
The overall profit margins of Marks and Spencer are significantly higher as compared to Sainsbury because of its chief focus in the clothing business which comes with higher margin products as compared to the general departmental goods of Sainsbury, and even though Sainsbury does sell clothing, its revenues from other businesses severely affect the profit margins of the company. Overall, a net profit margin of just about 1.5% is extremely risky and does not provide Sainsbury with many opportunities to take considerable business risks for expansion.
CAGR and YoY Growth
| Marks and Spencer | 2009 | 2008 | 2007 | 2006 |
| Revenues | 9062.10 | 9022.00 | 8588.10 | 7797.70 |
| Net Profit | 508.00 | 821.00 | 659.20 | 520.60 |
| YoY Growth (Net Profit) | -38.12 % | 24.54 % | 26.62 % | – |
| YoY Growth (Revenues) | 0.44 % | 5.05 % | 10.14 % | – |
| CAGR = {(R2008/R2004)(1/4)}-1 | 5.14 % | |||
Table 3: Amounts in £ millions. (Marks and Spencer Group Plc, 2010) (Biafore, 2004: 108)
| J Sainsbury | 2009 | 2008 | 2007 | 2006 |
| Revenues | 18911.00 | 17837.00 | 17151.00 | 16061.00 |
| Net Profit | 289.00 | 329.00 | 324.00 | 58.00 |
| YoY Growth (Net Profit) | -12.16 % | 1.54 % | 458.62 % | – |
| YoY Growth (Revenues) | 6.02 % | 4.00 % | 6.79 % | – |
| CAGR = {(R2008/R2004)(1/4)}-1 | 5.60 % | |||
Table 4: Amounts in £ millions. (J Sainsbury, 2010) (Biafore, 2004: 108)
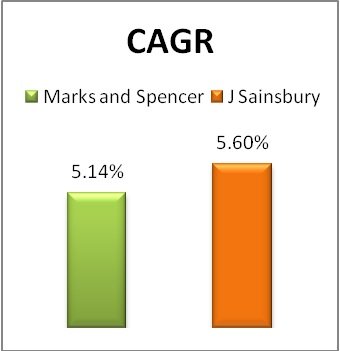
Figure 8: cagr
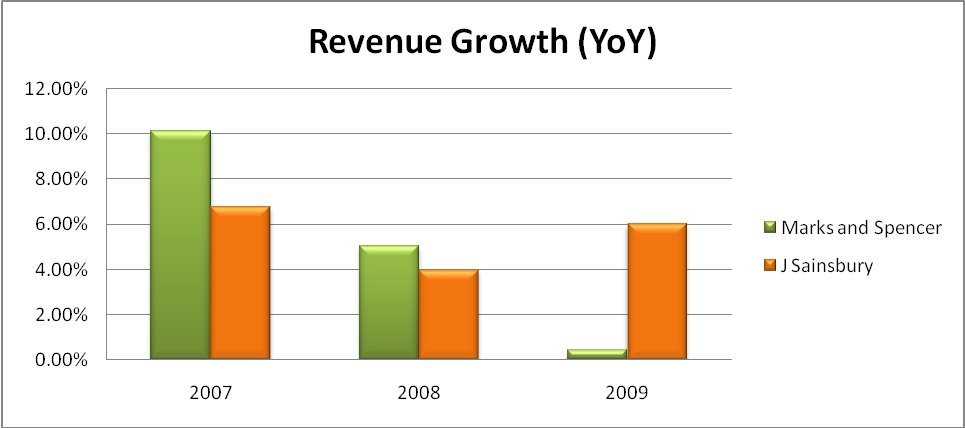
Figure 9: YoY Revenues
In terms of sheer growth velocity in percentage, M&S’ growth speed has fallen sharply from over 10% per annum to just about 0.4% in just 3 years, whereas Sainsbury is far ahead in the same matter, even though the growth rate of Sainsbury was over 6% in 2007, and was over 6% again in 2009, this proves that even though Sainsbury is growing at a higher compounded rate. This is also supported by the CAGR figures which are about 5.6 for Sainsbury and 5.1 for M&S; and if M&S would not have presented the over 10% growth in 2007, these figures would have been completely different, with J Sainsbury taking a clear lead by a wide margin.
Undoubtedly, the CAGR analysis shows us that Sainsbury is a better option for short to long term investors who are looking for steady but sure growth, whereas the trend for M&S is quite uncertain and highly volatile.
Return on Investments
| Marks and Spencer | J Sainsbury | |
| Return on Assets | 6.99 % | 2.79 % |
| Return on Equity | 24.403 % | 6.60 % |
| Return on Capital Employed | 14.26 % | 6.55 % |
Table 5: ROInv; for financial year 2009 (Marks and Spencer Group Plc, 2010) (J Sainsbury, 2010) (Brigham and Houston, 2007: 114-121)
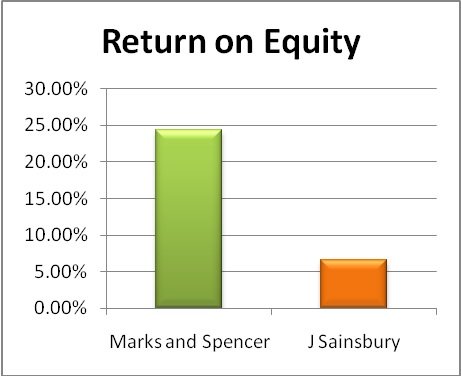
Figure 10: ROE
With a net income of 289 (Sainsbury) against the NI of M&S which is 508, it comes as no surprise that the rate of return on equity of M&S would be considerably higher than Sainsbury, especially since the Shareholders equity fund of Sainsbury is higher than M&S’ by 115%.
Then again, M&S’ business is also based on franchising, whereas Sainsbury’s business is highly focused on self owned assets, and therefore the ROE of 24.4% should not be judged by numbers alone, as it could be wrongly interpreted.
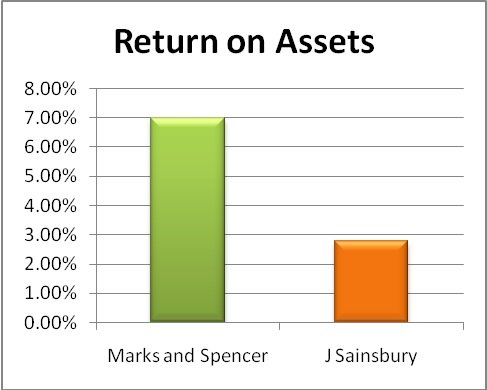
Figure 11: ROA
As discussed previously, some stores of M&S are also franchised, especially most of its international stores; and therefore the company owns lesser assets as compared to Sainsbury, and hence Marks and Spencer takes a lead here again thanks to higher net income and comparatively lesser assets.
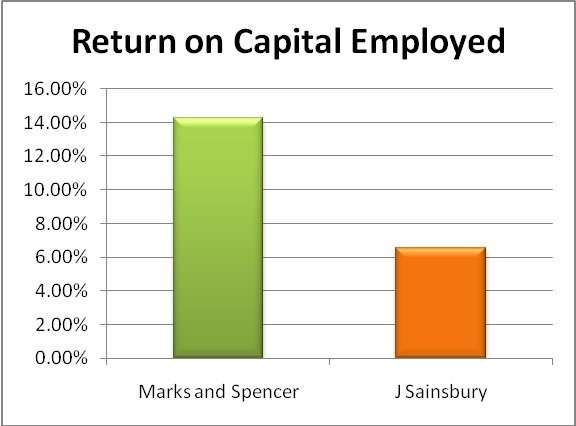
Figure 12: ROCE
Undoubtedly, a company that holds a colossal amount of assets and makes lower profits (Sainsbury) as compared to another company that holds lesser assets and makes a higher profit (Marks and Spencer) will have a lower ROCE. And since Sainsbury holds assets worth 30% more than M&S, and a net profit which is approximately 45% lower than M&S, then a difference of 6.5 (Sainsbury) and a 14.2 (M&S) does not come as a surprise.
And since the Debt to asset ratio (see table 8) of both companies stand at a ratio of 1:1, then such results are not unexpected.
In terms of overall capital management, M&S has proved itself to be more aggressive and a better performer; whereas, Sainsbury is still stuck on using the traditional methodologies of business, with little improvement in its efforts. Nevertheless, EPS is a stronger factor and carries a higher authority over returns and stock prices.
Asset Utilization Ratios
| Marks and Spencer | J Sainsbury | |
| Fixed Asset Turnover | 1.53 | 2.246 |
| Total Asset Turnover | 1.26 | 1.877 |
| Inventory Turnover[1] | 11.10 | 26.094 |
Table 6: Asset Uti. (2009). Average inventory, Avg. Fixed assets, and Avg. Assets were calculated based on figures of year ending 2008 and 2009. (J Sainsbury, 2010) (Marks and Spencer Group Plc, 2010) (Tuller, 1994: 86)
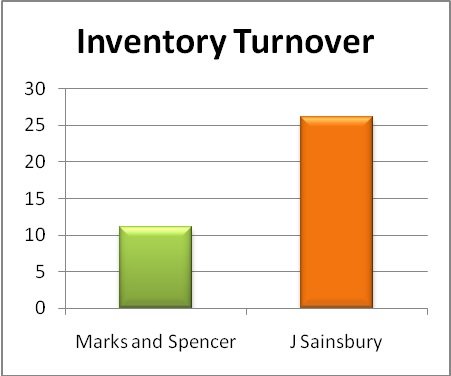
Figure 13: Inv. turnover
The accounting fault of Sainsbury, which enables it to include selling expenses in Cost of Goods sold has finally been presented as an advantage for the company, as it has enabled the company to present an inventory turnover ratio of 26.1 against just 11.1 of M&S. Although it should be noted that considering the industry performance and general business, an inventory turnover of 11 is considered to be great; especially in clothing business where holding the stock for too long could in turn make the stocks obsolete, but a 26 is superb for Sainsbury considering the fact that it also deals in the FMCG sector and the risk of expiry of products is of higher importance.

Figure 14: AT
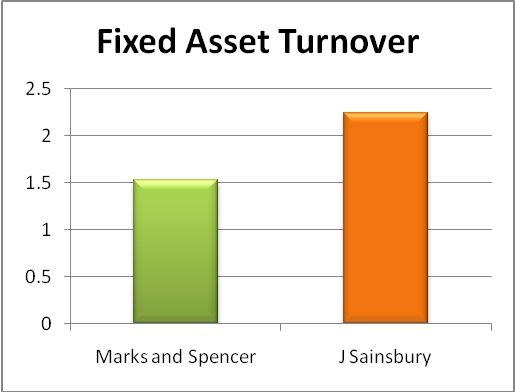
Figure 15: FA Turnover
Again due to its mammoth revenues Sainsbury takes the lead in both of the asset turnover ratios. Since their businesses primarily deal with investment in Fixed assets (land), but still, considering the margins of both the companies, these results still don’t prove that Sainsbury is a better investment.
Liquidity Analysis
| Marks and Spencer | J Sainsbury | |
| Current Ratio | 0.60 | 0.545 |
| Quick ratio | 0.37 | 0.309 |
Table 7: Liquidity analysis based on balance sheet of 2009 (J Sainsbury, 2010) (Marks and Spencer Group Plc, 2010) (Berman, Knight and Case, 2006: 162-165)
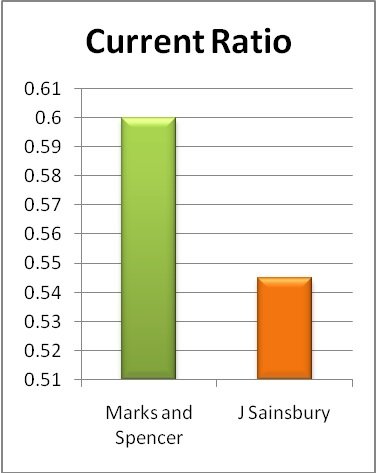
Figure 16: CR
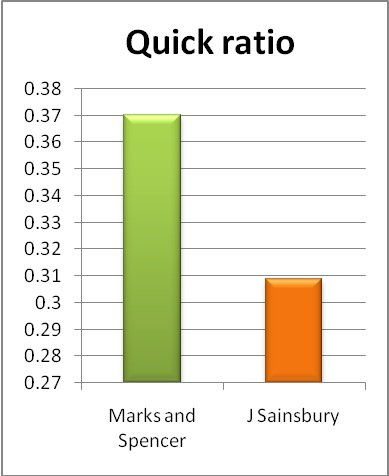
Figure 17: QR
Both the companies perform extremely poorly when it comes to liquidity and debt ratios, especially considering the fact that they get most of their products on credit from suppliers and sell them for cash at their respective stores. A current ratio of 1+ is a minimum boundary for retail businesses, and the same goes for quick ratio which seems even worse as the inventories have been removed from the calculations. In layman’s terms this means that if the company were to square off its short term debts with current assets, they will only be able to pay back 60% (Marks and Spencer) & 54% (J Sainsbury) respectively.
Debt Utilization Ratios
| Marks and Spencer | J Sainsbury | |
| Debt to equity ratio | 3.49 or 349% | 2.292 or 229.2% |
| Interest Coverage Ratio | 1.693* | 1.695* |
| Debt to assets ratio | 1.00 | 1.00 |
| Equity to assets | 0.286 | 0.436 |
Table 8: Debt Utilization: *Interest expenses figures were used to calculate Interest coverage and not net interest (which would make interest = Interest paid – Interest Received). All calculations were based on financial statements of 2009. (Block, Hirt and Short, 1999: 68)
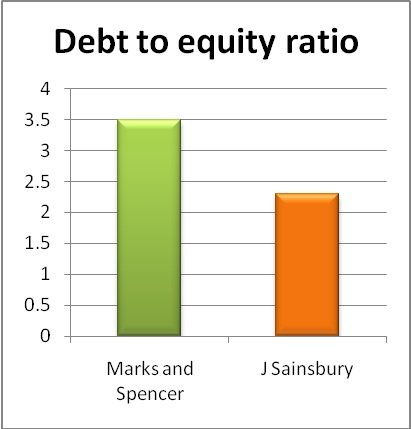
Figure 18: Debt to equity
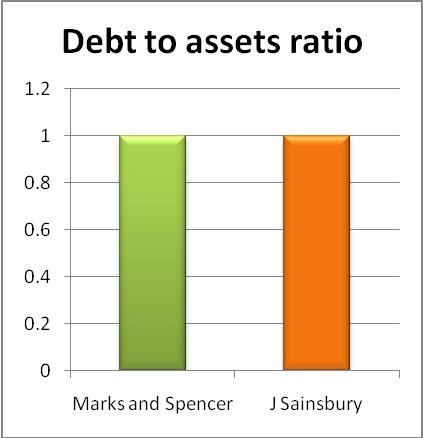
Figure 19: Debt to assets
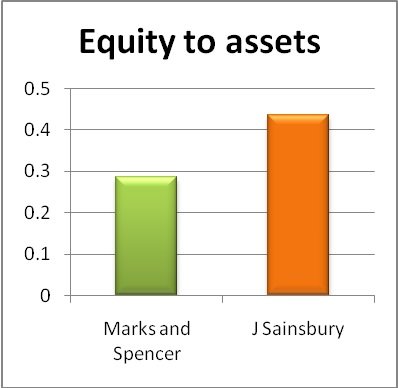
Figure 20: Eq – A

Figure 21: Int Coverage
As stated within previous segments, that Marks and Spencer is extremely aggressive in terms of expansion and investing borrowed funds, and the debt to equity ratio of 349% proves it, the company has been borrowing extensively from the markets to fulfil its needs for growth, which may also be a reason as to why the company’s stock, revenue growth (%), profit margins, and capitalization are amazingly volatile. Perhaps this is also the reason as to why the company is spending most of its earnings before taxes paying interest accrued on its debts. Although since Marks and Spencer as well as J Sainsbury PLC both are a part of the retail industry, which is a very capital intensive sector, a risk ratio of above 2 is considered quite normal; but then again this secures the position of Sainsbury, whilst leaving Marks and Spencer under considerable risk with Leverage ratio of almost 3.5.
The interest coverage ratio also shows the afore mentioned as a ratio of 1.69 for both companies indicates that both of them are paying most of their earnings before taxes towards the interests accrued on their respective debts. In other words, it is extremely risky for such companies as if the profits fall due to any unfortunate and unpredictable poor market environments or change in interest rates, these companies will only be making enough money to pay off the interests on their debts, or worse, maybe they won’t even be making enough to pay off their debts.
Overall, these companies must reduce their debts until the point this ratio reaches to a minimum level of 2.0, in general business terminology, an interest coverage ratio of 2.5 is considered to be great; but a ratio of 1.69 will be rated as poor performance by the scholar.
Degree of Combined Leverage (DCL)
The Degree of Operating Leverage (DOL)
| (2009) | Marks and Spencer | J Sainsbury |
| COGS | 5690.2 | 17875.0 |
| Revenues | 9062.1 | 18911.0 |
| Selling, General and Administrative exp. (SG&A) * | 2644.5 | 420.0 |
| DOL = (R – COGS) / (R – COGS – SG&A) | 4.63 | 1.68 |
Table 9: DOL; * SG&A is the sum of Selling & Marketing exp. + Administrative Expenses
Degree of Financial Leverage (DFL)
| (2009) | Marks and Spencer | J Sainsbury |
| EBIT | 870.7 | 673 |
| Interest | 164.5 | 96 |
| DFL = EBIT / (EBIT – I) | 1.23 | 1.16 |
Table 10: DFL
Degree of Combined leverage
Marks & Spencer = (9062.1 – 5690.2) / (9062.1 – 5690.2 – 2644.5 – 164.5)
Marks and Spencer = 5.99
J Sainsbury = (18911 – 17875) / (18911 – 17875 – 420 – 96)
J Sainsbury = 1.99
(Lee and Lee, 2006: 85-86)
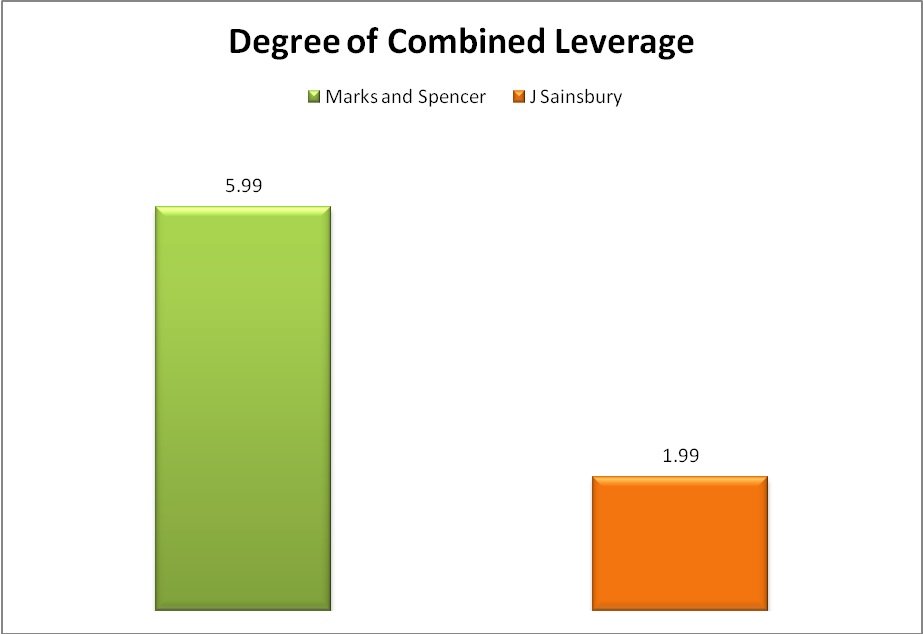
Figure 22: DCL
The degree of combined leverage is quite higher for Marks and Spencer based on the fact that its operating leverage is notably higher than its counterpart, which is due to the mis-presentation of SG&A expenses by J Sainsbury, as it considers “all costs” related to product selling within the Cost of goods sold, and therefore we would consider that these figures are manipulated to some extent. But also considering the fact that the profit margins of Sainsbury are much lower than those of Marks and Spencer, this doesn’t come as a surprise.
Dividend Yield and P/E Ratio
| Marks and Spencer | 2009 | 2008 | 2007 | 2006 |
| Dividends paid (per share figures) | 17.80 | 22.50 | 18.30 | 14.00 |
| EPS | 32.30 | 48.70 | 38.50 | 31.10 |
| Price on year end (31st dec) | 402 | 221 | 560 | 734 |
| Dividend Yield | 4.42 % | 10.18 % | 3.26 % | 1.90 % |
| P/E Ratio | 12.44 | 4.53 | 14.54 | 23.60 |
Table 11: P/E M&S
| J Sainsbury | 2009 | 2008 | 2007 | 2006 |
| Dividends paid (per share figures) | 13.20 | 12.00 | 9.75 | 8.00 |
| EPS | 16.40 | 19.60 | 18.90 | 3.80 |
| Price on year end (31st dec) | 323.50 | 336.50 | 425.25 | 409.25 |
| Dividend Yield | 4.08 % | 3.56 % | 2.29 % | 1.95 % |
| P/E Ratio | 19.72 | 17.16 | 22.50 | 107.697 |
Table 12: P/E Sainsbury
Limitations of Research
- Sainsbury considers all selling expenses and any other expenses related to the process of purchase of goods or raw materials to getting them to the customer as a part of COGS, which is a mistake; and was especially troublesome for this report as M&S does not do that.
- The prime focus of Sainsbury is on Groceries and M&S is on Clothing, and even though Sainsbury does deal in the clothing business, it is not entirely focused on the sector, and therefore the overall margins of the company were severely affected by this.
- The data was available for the last 4 years (2006-2009), it would’ve been better if it were available for 5 years as the trend lines would have been much more clearer.
Conclusion
Considering gearing analysis, the accounting mistake of Sainsbury helped it take a wide lead in terms of Debt to equity ratio, and with a debt to equity ratio of 2.29, on the other hand, with a debt to equity ratio of 3.49, Marks and Spencer proves that it is interested in revenue growth by means of expansion through funds from the markets. A 3.49 debt to equity ratio could be countered by the fact that the interest coverage ratio of both the companies stands equal at 1.69, which states that the companies are paying an equivalent percentage of their EBIT as interest on debts.
Nevertheless, two companies making a same mistake does not make it right; an interest coverage ratio of 1.69 is quite low and has been rated mediocre; not to mention the fact that it increases the risk of the company being affected by adverse market conditions or interest rates by times fold. But here Marks and Spencer stands quite safer considering the fact that its net profit margins stand on 7.26% (4 year average), whilst Sainsbury’s Net profit margins are only 1.40% (4 year average).
The degree of combined leverage further clarifies this with a DCL of 5.99 for Marks and Spencer, and a 1.99 DCL for Sainsbury. Even if we eradicate the scope of the COGS mis-presentation by Sainsbury, we still expect to see the ratio significantly below that of M&S’.
As far as working capital management is concerned, Marks and Spencer is indeed the better performer in terms of Return on investments, with return on assets, return on equity, and ROCE ratios 6.9%, 24.4%, and 14.2% respectively; all of which are far ahead of J Sainsbury. Undoubtedly, Marks and Spencer is the aggressive one amongst the two in terms of expansion and revenue growth.
Based on Inventory and asset turnover ratios, Sainsbury is a better manager of Working capital; but if we consider the interpretation mistake of Sainsbury’s COGS; these figures should be considered wrong; therefore the scholar has opted to declare a tie in assets and inventory turnover ratios; so as to remain unbiased of course.
This tie takes Marks and Spencer to the lead as it is a better performer in terms of ROA, ROE and ROCE.
Overall, Marks and Spencer is undoubtedly the better manager of funds, but due to the aggressive planning and policies of the company, it is also extremely volatile. Sainsbury on the other hand is much more stable.
Works Cited
- AnnualReports.com (2008) J Sainsbury PLC, [Online], Available: HYPERLINK “http://www.annualreports.com/Company/5158” http://www.annualreports.com/Company/5158 [10 February 2010].
- BBC News (2004) Sainsbury’s heads back to basics: Supermarket giant Sainsbury’s is to create 3,000 shopfloor jobs as part of a revival strategy aimed at boosting sales by £2.5bn over three years., 19October, [Online], Available: HYPERLINK “http://news.bbc.co.uk/2/hi/business/3755066.stm” http://news.bbc.co.uk/2/hi/business/3755066.stm [13 February 2010].
- Berman, K., Knight, J. and Case, J. (2006) Financial intelligence: a manager’s guide to knowing what the numbers really mean, Harvard Business Press.
- Berwin, L. (2010) Sales growth slows to 15-year low in January as snow hits trade , 9February, [Online], Available: HYPERLINK “http://www.retail-week.com/data/monthly-sales-data/brc-retail-sales-monitor-national/sales-growth-slows-to-15-year-low-in-january-as-snow-hits-trade/5010263.article” http://www.retail-week.com/data/monthly-sales-data/brc-retail-sales-monitor-national/sales-growth-slows-to-15-year-low-in-january-as-snow-hits-trade/5010263.article [12 February 2010].
- Biafore, B. (2004) Online investing hacks, Chicago: O’Reilly Media, Inc.
- Block, S.B., Hirt, G.A. and Short, J.D. (1999) Foundations of financial management, London: McGraw-Hill Ryerson, Limited.
- Brigham, E.F. and Houston, J.F. (2007) Fundamentals of financial management, Cengage Learning.
- Brigham, E.F. and Houston, J.F. (2007) Fundamentals of financial management, New York: Cengage Learning.
- Hailes, J. (N.D.) JULIA HAILES – MARKS & SPENCER (M&S), [Online], Available: HYPERLINK “http://www.juliahailes.com/Marks-and-Spencer.htm” http://www.juliahailes.com/Marks-and-Spencer.htm [10 February 2010].
- J Sainsbury (2010) Financial Statements; London Stock Exchange, [Online], Available: HYPERLINK “http://www.londonstockexchange.com/exchange/prices-and-news/stocks/exchange-insight/company-fundamentals.html?fourWayKey=GB00B019KW72GBGBXSET1” http://www.londonstockexchange.com/exchange/prices-and-news/stocks/exchange-insight/company-fundamentals.html?fourWayKey=GB00B019KW72GBGBXSET1 [10 February 2010].
- Lee, C.F. and Lee, A.C. (2006) Encyclopedia of finance, New York: Springer.
- Marks and Spencer Group Plc (2010) Financial Statements provided to London Stock Exchange, [Online], Available: HYPERLINK “http://www.londonstockexchange.com/exchange/prices-and-news/stocks/exchange-insight/company-fundamentals.html?fourWayKey=GB0031274896GBGBXSET1” http://www.londonstockexchange.com/exchange/prices-and-news/stocks/exchange-insight/company-fundamentals.html?fourWayKey=GB0031274896GBGBXSET1 [10 February 2010].
- Marks and Spencer PLC (2010) UK Stores, [Online], Available: HYPERLINK “http://corporate.marksandspencer.com/aboutus/where/uk_stores” http://corporate.marksandspencer.com/aboutus/where/uk_stores [13 February 2010].
- Office for National Statistics: Newport (2009) Retail Sales: Business Monitor SDM28, December, [Online], Available: HYPERLINK “http://www.statistics.gov.uk/downloads/theme_economy/SDM28_December_2009.pdf” http://www.statistics.gov.uk/downloads/theme_economy/SDM28_December_2009.pdf [12 February 2010].
- Retail Knowledge Bank (2009) Top 50 UK Retailers 2008-2009, [Online], Available: HYPERLINK “http://www.retail-week.com/a-z/top-50-retailers/2009/” http://www.retail-week.com/a-z/top-50-retailers/2009/ [12 February 2010].
- Retail Week (2010) Retailers compete for share of £1.6bn Valentine’s sales bonanza, 12February, [Online], Available: HYPERLINK “http://www.retail-week.com/retail-sectors/retailers-compete-for-share-of-16bn-valentines-sales-bonanza/5010412.article” http://www.retail-week.com/retail-sectors/retailers-compete-for-share-of-16bn-valentines-sales-bonanza/5010412.article [12 February 2010].
- Talking Retail weekly (2008) Marks & Spencer holds 20% off sale, 19November, [Online], Available: HYPERLINK “http://www.talkingretail.com/news/industry-news/11517-marks-a-spencer-holds-20-off-sale.html” http://www.talkingretail.com/news/industry-news/11517-marks-a-spencer-holds-20-off-sale.html [11 February 2010].
- Tuller, L.W. (1994) The small business valuation book, Chicago: Adams Media.
- Yahoo! Finance (2012) MARKS & SPENCER (MKS.L), 12February, [Online], Available: HYPERLINK “http://uk.finance.yahoo.com/echarts?s=MKS.L” \l “chart2:symbol=mks.l;range=5y;compare=sbry.l;indicator=volume;charttype=line;crosshair=on;ohlcvalues=0;logscale=on;source=undefined” http://uk.finance.yahoo.com/echarts?s=MKS.L#chart2:symbol=mks.l;range=5y;compare=sbry.l;indicator=volume;charttype=line;crosshair=on;ohlcvalues=0;logscale=on;source=undefined [12 February 2012].
Bibliography
- Barclay, M.J. and Smith, C.W. (2005) ‘The Capital Structure Puzzle: The Evidence Revisited’, Journal of Applied Corporate Finance, vol. 17, no. 1, April, pp. 8-17.
- Beattie, V., Goodacre, A. and Thomson, S.J. (2006) ‘Corporate financing decisions: UK survey evidence’, Journal of Business Finance and Accounting, vol. 33, no. 9-10, pp. 1402-1434.
- Dubofsky, D.A. and Miller, T.W. (2006) Derivatives: valuation and risk management, Oxford University Press.
- Keane, S. (1978) ‘The cost of capital as a financial decision tool’, Journal of Business finance and accounting, pp. 339-353.
- Ogilvie, J. (1999) ‘The capital asset pricing model and Modigliani & Miller’s capital structure theory’, Management Accounting (British), vol. 77, no. 2, February.
Appendices
Appendix 1: Table of Figures
- Figure 1: Logo courtesy: (Hailes, N.D.)
- Figure 2: Logo Courtesy: (AnnualReports.com, 2008)
- Figure 3: Stock Prices on London Stock Exchange [2005-current] (Yahoo! Finance, 2012)
- Figure 4: Gross Profit Margins
- Figure 5: Net profit Margins
- Figure 6: Net profits
- Figure 7: Revenues
- Figure 8: cagr
- Figure 9: YoY Revenues
- Figure 10: ROE
- Figure 11: ROA
- Figure 12: ROCE
- Figure 13: Inv. turnover
- Figure 14: AT
- Figure 15: FA Turnover
- Figure 16: CR
- Figure 17: QR
- Figure 18: Debt to equity
- Figure 19: Debt to assets
- Figure 20: Eq – A
- Figure 21: Int Coverage
- Figure 22: DCL
Appendix 2: Financial Statements M&S
| Income Statements | Interim (£m) | 2009 (£m) | 2008 (£m) | 2007 (£m) | 2006 (£m) |
| Fiscal year end | 26-Sep-09 | 28-Mar-09 | 29-Mar-08 | 31-Mar-07 | 01-Apr-06 |
| Duration (months) | 6 | 12 | 12 | 12 | 12 |
| Accounting format | IFRS | IFRS | IFRS | IFRS | IFRS |
| Operating Income | |||||
| Group turnover & share of J.V. | 4,335.80 | 9,062.10 | 9,022.00 | 8,588.10 | 7,797.70 |
| Share of J.V sales | – | – | – | – | – |
| Group turnover | 4,335.80 | 9,062.10 | 9,022.00 | 8,588.10 | 7,797.70 |
| Gross profit | – | 3,371.90 | 3,486.80 | 3,341.20 | 2,985.60 |
| Other operating income | – | 41.50 | 49.70 | 66.10 | 18.60 |
| Net other gains | – | 6.40 | 27.00 | 1.90 | -5.70 |
| Total operating income | 4,335.80 | 9,110.00 | 9,098.70 | 8,656.10 | 7,810.60 |
| Operating Expenses (by function) | |||||
| Cost of sales | – | -5,690.20 | -5,535.20 | -5,246.90 | -4,812.10 |
| Selling, marketing & distribution | – | -2,074.40 | -1,912.70 | -1,779.20 | -1,625.70 |
| Administrative expenses | – | -570.10 | -534.50 | -584.10 | -522.70 |
| Research & development | – | – | – | – | – |
| Depreciation (property, plant & equipment) | -213.70 | -381.70 | -296.30 | -268.50 | -261.30 |
| Amortisation of intangibles | – | -27.30 | -21.30 | -14.20 | -12.70 |
| Impairment of goodwill | – | – | – | – | – |
| One-off items (by function) | – | 95.40 | 95.00 | – | – |
| Other operating costs (by function) | – | – | – | – | – |
| Total operating expenses (by function) | – | -8,239.30 | -7,887.40 | -7,610.20 | -6,960.50 |
| Operating Profit | |||||
| Operating profit (as calculated) | 373.40 | 870.70 | 1,211.30 | 1,045.90 | 850.10 |
| Operating profit (as stated) | 373.40 | 870.70 | 1,211.30 | 1,045.90 | 850.10 |
| EBIT (as calculated) | 373.40 | 870.70 | 1,211.30 | 1,045.90 | 850.10 |
| Interest & other financial income | 139.80 | 349.20 | 348.20 | 33.80 | 30.50 |
| Interest & other financial expense | -206.50 | -513.70 | -430.40 | -112.60 | -134.90 |
| Net interest | -66.70 | -164.50 | -82.20 | -78.80 | -104.40 |
| Share of profit from associates | – | – | – | – | – |
| One-off items (previously exceptionals) | – | – | – | -30.40 | – |
| Profit on ordinary activities before tax | 306.70 | 706.20 | 1,129.10 | 936.70 | 745.70 |
| Tax | -85.90 | -199.40 | -308.10 | -277.50 | -225.10 |
| Profit on ordinary activities after tax | 220.80 | 506.80 | 821.00 | 659.20 | 520.60 |
| Profit attributable to minority interests | -3.50 | -1.20 | -0.70 | – | – |
| Profit attributable to equity shareholders | 224.30 | 508.00 | 821.70 | 659.90 | 523.10 |
| Ordinary dividends | -149.60 | -354.60 | -343.60 | -260.60 | -204.10 |
| Other dividends | – | – | – | – | – |
| Retained profit | 74.70 | 153.40 | 478.10 | 399.30 | 319.00 |
| EPS basic | 14.30 | 32.30 | 49.20 | 39.10 | 31.40 |
| EPS diluted | 14.20 | 32.30 | 48.70 | 38.50 | 31.10 |
| Dividend per share | 5.50 | 17.80 | 22.50 | 18.30 | 14.00 |
| Balance Sheet | Interim (£m) | 2009 (£m) | 2008 (£m) | 2007 (£m) | 2006 (£m) |
| Fiscal year end | 26-Sep-09 | 28-Mar-09 | 29-Mar-08 | 31-Mar-07 | 01-Apr-06 |
| Duration (months) | 6 | 12 | 12 | 12 | 12 |
| Accounting format | IFRS | IFRS | IFRS | IFRS | IFRS |
| Non-Current Assets | |||||
| Intangible assets | – | 281.10 | 187.60 | 124.60 | 94.00 |
| Goodwill | – | 119.20 | 117.90 | 69.50 | 69.50 |
| Total intangible assets | 422.30 | 400.30 | 305.50 | 194.10 | 163.50 |
| Property, plant and equipment | 4,735.40 | 4,834.00 | 4,704.00 | 4,044.50 | 3,575.80 |
| Retirement benefit assets | – | – | 504.00 | – | – |
| Deferred tax assets | 0.00 | 1.60 | 0.00 | 11.60 | 35.50 |
| Assets held for sale | – | – | – | – | – |
| Available-for-sale financial assets | – | – | – | – | – |
| Derivative financial assets | 132.10 | 254.00 | 18.20 | – | – |
| Financial assets held at fair value through P&L | – | 3.00 | – | – | – |
| Financial assets held to maturity | – | – | – | – | – |
| Trade and other receivables | 311.50 | 336.80 | 410.00 | 247.00 | 242.80 |
| Investments in JVs/associates | 11.70 | 13.80 | 9.60 | 9.30 | 9.00 |
| Other non-current asset investments | 26.50 | 24.80 | 28.00 | 28.10 | 41.80 |
| Total non-current assets | 5,639.50 | 5,868.30 | 5,979.30 | 4,534.60 | 4,068.40 |
| Current Assets | |||||
| Inventories | 660.60 | 536.00 | 488.90 | 416.30 | 374.30 |
| Trade and other receivables | 307.00 | 285.20 | 307.60 | 196.70 | 210.50 |
| Cash and cash equivalents | 296.50 | 422.90 | 318.00 | 180.10 | 362.60 |
| Assets held for sale | – | – | – | – | – |
| Available-for-sale financial assets | – | – | 43.50 | 46.20 | 43.60 |
| Derivative financial assets | 27.00 | 92.60 | 18.40 | 2.40 | 76.40 |
| Financial assets held at fair value through P&L | – | 53.10 | – | – | – |
| Financial assets held to maturtiy | – | – | – | – | – |
| Available for sale assets | – | – | – | – | – |
| Other fair value assets | – | – | – | – | – |
| Other current assets | 89.50 | – | 5.30 | 4.70 | 74.70 |
| Total current assets | 1,380.60 | 1,389.80 | 1,181.70 | 846.40 | 1,142.10 |
| Total assets | 7,020.10 | 7,258.10 | 7,161.00 | 5,381.00 | 5,210.50 |
| Equity | |||||
| Share capital | 394.70 | 394.40 | 396.60 | 424.90 | 420.60 |
| Share premium account | 239.00 | 236.20 | 231.40 | 202.90 | 162.30 |
| Revaluation reserve | – | – | – | – | – |
| Other reserves | -4,348.50 | -4,277.00 | -4,379.20 | -4,378.10 | -4,436.40 |
| Retained earnings | 5,511.00 | 5,728.10 | 5,707.90 | 5,397.10 | 5,008.80 |
| Equity shareholders funds | 1,796.20 | 2,081.70 | 1,956.70 | 1,646.80 | 1,155.30 |
| Minority interests | 16.10 | 18.90 | 7.30 | 1.40 | – |
| Total equity | 1,812.30 | 2,100.60 | 1,964.00 | 1,648.20 | 1,155.30 |
| Non-Current Liabilities | |||||
| Long term borrowings | -2,077.70 | -2,117.90 | -1,936.50 | -1,234.50 | -1,133.80 |
| Deferred tax liabilities | -86.40 | -225.50 | -372.10 | -7.30 | -6.10 |
| Derivative financial instruments | -1.40 | -59.30 | 0.00 | -0.20 | -9.50 |
| Financial liabilities held at fair value through P&L | – | – | – | – | – |
| Other financial instruments | – | -72.00 | – | – | – |
| Retirement benefit obligations | -521.10 | -152.20 | -693.70 | -780.20 | -794.90 |
| Other liabilities/provisions | -287.10 | -223.70 | -205.80 | -104.40 | -93.90 |
| Total non-current liabilities | -2,973.70 | -2,850.60 | -3,208.10 | -2,126.60 | -2,038.20 |
| Current Liabilities | |||||
| Short term borrowings | -835.40 | -942.80 | -878.60 | -461.00 | -1,052.80 |
| Trade creditors | -1,111.60 | -1,073.50 | -976.60 | -1,043.90 | -867.80 |
| Current tax payables | -114.10 | -78.90 | -37.50 | -87.30 | -58.70 |
| Derivative financial instruments | -70.70 | -76.20 | -35.10 | -8.30 | -8.00 |
| Financial liabilities held at fair value through P&L | – | – | – | – | – |
| Other financial instruments | – | -71.90 | – | – | – |
| Other liabilities/provisions | -102.30 | -63.60 | -61.10 | -5.70 | -29.70 |
| Total current liabilities | -2,234.10 | -2,306.90 | -1,988.90 | -1,606.20 | -2,017.00 |
| Net current assets | -853.50 | -917.10 | -807.20 | -759.80 | -874.90 |
| Total assets less current liabilities | 4,786.00 | 4,951.20 | 5,172.10 | 3,774.80 | 3,193.50 |
| Total liabilities | -7,020.10 | -7,258.10 | -7,161.00 | -5,381.00 | -5,210.50 |
| Pension surplus/deficit (including prepayment) | – | -135.40 | -189.70 | -780.20 | -794.90 |
| Pension surplus/deficit (excluding prepayment) | – | – | – | – | – |
| Cash Flow | Interim (£m) | 2009 (£m) | 2008 (£m) | 2007 (£m) | 2006 (£m) |
| Fiscal year end | 26-Sep-09 | 28-Mar-09 | 29-Mar-08 | 31-Mar-07 | 01-Apr-06 |
| Duration (months) | 6 | 12 | 12 | 12 | 12 |
| Accounting format | IFRS | IFRS | IFRS | IFRS | IFRS |
| Cash Flows from Operating Activities | |||||
| Cash generated from operations | 518.20 | 1,371.90 | 1,236.00 | 1,443.30 | 1,197.50 |
| Interest paid | -62.80 | -197.10 | -88.90 | -123.40 | -142.80 |
| Income tax paid | -38.00 | -81.30 | -166.20 | -150.80 | -101.50 |
| Other inflow/outflow from operating activities | – | – | – | – | – |
| Net cash generated from operating activities | 417.40 | 1,093.50 | 980.90 | 1,169.10 | 953.20 |
| Cash Flows from Investing Activities | |||||
| Acquisition of subsidiary, net of cash acquired | -5.40 | – | -46.40 | – | 0.00 |
| Disposal of subsidiary, net of cash acquired | – | – | 0.00 | 48.80 | 0.00 |
| Net acquisitions, & disposals, net of cash required | -5.40 | – | -46.40 | 48.80 | 0.00 |
| Purchases of property, plant and equipment | -171.30 | -540.80 | -958.40 | -666.90 | -298.50 |
| Proceeds from sale of property, plant and equipment | 20.80 | 58.30 | 91.60 | 2.90 | 45.10 |
| Net cash from investments in property, plant & equipment | -150.50 | -482.50 | -866.80 | -664.00 | -253.40 |
| Purchases of intangible assets | -26.40 | -121.60 | -60.60 | -46.50 | -10.90 |
| Purchases of short term securities | – | – | 2.80 | -2.60 | – |
| Purchases of available for sale financial assets | – | – | – | – | – |
| Total purchases of investments | -36.90 | -5.50 | – | – | -3.00 |
| Proceeds from sale of available for sale financial assets | – | – | – | – | 1.00 |
| Proceeds from sale of investments in other companies | – | – | – | – | – |
| Total proceeds from sales of investments | – | – | – | 0.30 | 1.00 |
| Loans granted to related parties | – | – | – | – | – |
| Loan repayments received from related parties | – | – | – | – | – |
| Interest received | 0.10 | 12.70 | 4.80 | 13.20 | 12.90 |
| Dividends received | – | – | – | – | – |
| Other inflow/ outflow from investing activities | – | – | – | – | – |
| Net cash generated from investing activities | -219.10 | -596.90 | -966.20 | -650.80 | -253.40 |
| Cash Flows from Financing Activities | |||||
| Proceeds from borrowings | 13.60 | 108.10 | 958.00 | 715.50 | – |
| Repayments of borrowings | -125.80 | -26.80 | -3.50 | -1,194.70 | -420.00 |
| Dividends paid to company’s shareholders | -149.60 | -354.60 | -343.60 | -260.60 | -204.10 |
| Dividends paid to minority interests | – | – | – | – | – |
| Other inflow/ outflow from financing activities | -87.80 | -50.70 | -556.20 | -12.40 | 55.80 |
| Net cash generated from financing activities | -349.60 | -324.00 | 54.70 | -752.20 | -568.30 |
| Cash Flows for the Year | |||||
| Net increase in cash and bank overdrafts | -151.30 | 172.60 | 69.40 | -233.90 | 131.50 |
| Exchange gains and losses on cash and bank overdrafts | -2.20 | 7.80 | 1.50 | -1.50 | 1.60 |
| Net increase in cash for the year | -153.50 | 180.40 | 70.90 | -235.40 | 133.10 |
| Cash and bank overdrafts at beginning of period | 298.30 | 117.90 | 47.00 | 282.40 | 149.30 |
| Cash and bank overdrafts at end of period | 144.80 | 298.30 | 117.90 | 47.00 | 282.40 |
Appendix 3: Financial Statements J Sainsbury
| Income Statements | Interim (£m) | 2009 (£m) | 2008 (£m) | 2007 (£m) | 2006 (£m) |
| Fiscal year end | 03-Oct-09 | 21-Mar-09 | 22-Mar-08 | 24-Mar-07 | 25-Mar-06 |
| Duration (months) | 6.5 | 12 | 12 | 12 | 12 |
| Accounting format | IFRS | IFRS | IFRS | IFRS | IFRS |
| Operating Income | |||||
| Group turnover & share of J.V. | 10,433.00 | 18,911.00 | 17,837.00 | 17,151.00 | 16,061.00 |
| Share of J.V sales | – | – | – | – | – |
| Group turnover | 10,433.00 | 18,911.00 | 17,837.00 | 17,151.00 | 16,061.00 |
| Gross profit | 556.00 | 1,036.00 | 1,002.00 | 1,172.00 | 1,067.00 |
| Other operating income | 15.00 | 57.00 | 30.00 | 17.00 | 1.00 |
| Net other gains | – | – | – | – | – |
| Total operating income | 10,448.00 | 18,968.00 | 17,867.00 | 17,168.00 | 16,062.00 |
| Operating Expenses (by function) | |||||
| Cost of sales | -9,877.00 | -17,875.00 | -16,835.00 | -15,979.00 | -14,994.00 |
| Selling, marketing & distribution | – | – | – | – | – |
| Administrative expenses | -214.00 | -420.00 | -502.00 | -669.00 | -839.00 |
| Research & development | – | – | – | – | – |
| Depreciation (property, plant & equipment) | -240.00 | -453.00 | -463.00 | -479.00 | -449.00 |
| Amortisation of intangibles | -7.00 | -15.00 | -18.00 | -21.00 | -21.00 |
| Impairment of goodwill | – | – | – | – | – |
| One-off items (by function) | – | – | – | – | – |
| Other operating costs (by function) | – | – | – | – | – |
| Total operating expenses (by function) | -10,091.00 | -18,295.00 | -17,337.00 | -16,648.00 | -15,833.00 |
| Operating Profit | |||||
| Operating profit (as calculated) | 357.00 | 673.00 | 530.00 | 520.00 | 229.00 |
| Operating profit (as stated) | 357.00 | 673.00 | 530.00 | 520.00 | 229.00 |
| EBIT (as calculated) | 357.00 | 673.00 | 530.00 | 520.00 | 229.00 |
| Interest & other financial income | 120.00 | 301.00 | 313.00 | 64.00 | 30.00 |
| Interest & other financial expense | -180.00 | -397.00 | -362.00 | -107.00 | -117.00 |
| Net interest | -60.00 | -96.00 | -49.00 | -43.00 | -87.00 |
| Share of profit from associates | 45.00 | -111.00 | -2.00 | – | – |
| One-off items (previously exceptionals) | – | – | – | – | -38.00 |
| Profit on ordinary activities before tax | 342.00 | 466.00 | 479.00 | 477.00 | 104.00 |
| Tax | -90.00 | -177.00 | -150.00 | -153.00 | -46.00 |
| Profit on ordinary activities after tax | 252.00 | 289.00 | 329.00 | 324.00 | 58.00 |
| Profit attributable to minority interests | – | – | 0.00 | -1.00 | -6.00 |
| Profit attributable to equity shareholders | 252.00 | 289.00 | 329.00 | 325.00 | 64.00 |
| Ordinary dividends | -167.00 | -218.00 | -178.00 | -140.00 | -131.00 |
| Other dividends | – | – | – | – | – |
| Retained profit | 85.00 | 71.00 | 151.00 | 185.00 | -67.00 |
| EPS basic | 14.00 | 16.60 | 19.10 | 19.20 | 3.80 |
| EPS diluted | 13.80 | 16.40 | 18.60 | 18.90 | 3.80 |
| Dividend per share | 4.00 | 13.20 | 12.00 | 9.75 | 8.00 |
| Balance Sheet | Interim (£m) | 2009 (£m) | 2008 (£m) | 2007 (£m) | 2006 (£m) |
| Fiscal year end | 03-Oct-09 | 21-Mar-09 | 22-Mar-08 | 24-Mar-07 | 25-Mar-06 |
| Duration (months) | 6.5 | 12 | 12 | 12 | 12 |
| Accounting format | IFRS | IFRS | IFRS | IFRS | IFRS |
| Non-Current Assets | |||||
| Intangible assets | – | 46.00 | 51.00 | 63.00 | 82.00 |
| Goodwill | – | 114.00 | 114.00 | 112.00 | 109.00 |
| Total intangible assets | 157.00 | 160.00 | 165.00 | 175.00 | 191.00 |
| Property, plant and equipment | 7,997.00 | 7,821.00 | 7,424.00 | 7,176.00 | 7,060.00 |
| Retirement benefit assets | – | – | 495.00 | – | – |
| Deferred tax assets | 57.00 | – | – | – | 55.00 |
| Assets held for sale | – | – | – | – | – |
| Available-for-sale financial assets | 121.00 | 97.00 | 106.00 | 137.00 | 113.00 |
| Derivative financial assets | 37.00 | 31.00 | – | – | – |
| Financial assets held at fair value through P&L | – | – | – | – | – |
| Financial assets held to maturity | – | – | – | – | – |
| Trade and other receivables | 45.00 | 45.00 | 55.00 | 50.00 | – |
| Investments in JVs/associates | 358.00 | 288.00 | 148.00 | 98.00 | 10.00 |
| Other non-current asset investments | – | – | – | – | 1,473.00 |
| Total non-current assets | 8,772.00 | 8,442.00 | 8,393.00 | 7,636.00 | 8,902.00 |
| Current Assets | |||||
| Inventories | 757.00 | 689.00 | 681.00 | 590.00 | 576.00 |
| Trade and other receivables | 274.00 | 195.00 | 206.00 | 197.00 | 276.00 |
| Cash and cash equivalents | 665.00 | 627.00 | 719.00 | 1,128.00 | 1,028.00 |
| Assets held for sale | 2.00 | 21.00 | 112.00 | 25.00 | 25.00 |
| Available-for-sale financial assets | – | – | – | – | 52.00 |
| Derivative financial assets | 40.00 | 59.00 | 4.00 | – | – |
| Financial assets held at fair value through P&L | – | – | – | – | – |
| Financial assets held to maturtiy | – | – | – | – | – |
| Available for sale assets | – | – | – | – | – |
| Other fair value assets | – | – | – | – | – |
| Other current assets | – | – | – | – | 1,888.00 |
| Total current assets | 1,738.00 | 1,591.00 | 1,722.00 | 1,940.00 | 3,845.00 |
| Total assets | 10,510.00 | 10,033.00 | 10,115.00 | 9,576.00 | 12,747.00 |
| Equity | |||||
| Share capital | 528.00 | 501.00 | 499.00 | 495.00 | 489.00 |
| Share premium account | 1,026.00 | 909.00 | 896.00 | 857.00 | 782.00 |
| Revaluation reserve | – | – | – | – | – |
| Other reserves | 202.00 | 489.00 | 1,174.00 | 813.00 | 667.00 |
| Retained earnings | 2,580.00 | 2,477.00 | 2,366.00 | 2,184.00 | 1,948.00 |
| Equity shareholders funds | 4,336.00 | 4,376.00 | 4,935.00 | 4,349.00 | 3,886.00 |
| Minority interests | – | – | – | – | 79.00 |
| Total equity | 4,336.00 | 4,376.00 | 4,935.00 | 4,349.00 | 3,965.00 |
| Non-Current Liabilities | |||||
| Long term borrowings | -2,364.00 | -2,177.00 | -2,084.00 | -2,090.00 | -2,178.00 |
| Deferred tax liabilities | – | -95.00 | -321.00 | -168.00 | 0.00 |
| Derivative financial instruments | -14.00 | -8.00 | -18.00 | -43.00 | -2.00 |
| Financial liabilities held at fair value through P&L | – | – | – | – | – |
| Other financial instruments | – | – | – | – | – |
| Retirement benefit obligations | -928.00 | -309.00 | 0.00 | -103.00 | -658.00 |
| Other liabilities/provisions | -151.00 | -149.00 | -152.00 | -102.00 | -1,134.00 |
| Total non-current liabilities | -3,457.00 | -2,738.00 | -2,575.00 | -2,506.00 | -3,972.00 |
| Current Liabilities | |||||
| Short term borrowings | -96.00 | -154.00 | -118.00 | -373.00 | -253.00 |
| Trade creditors | -2,272.00 | -2,488.00 | -2,280.00 | -2,267.00 | -2,094.00 |
| Current tax payables | -280.00 | -202.00 | -191.00 | -65.00 | -63.00 |
| Derivative financial instruments | -52.00 | -56.00 | -6.00 | -2.00 | -10.00 |
| Financial liabilities held at fair value through P&L | – | – | – | – | – |
| Other financial instruments | – | – | – | – | – |
| Other liabilities/provisions | -17.00 | -19.00 | -10.00 | -14.00 | -2,390.00 |
| Total current liabilities | -2,717.00 | -2,919.00 | -2,605.00 | -2,721.00 | -4,810.00 |
| Net current assets | -979.00 | -1,328.00 | -883.00 | -781.00 | -965.00 |
| Total assets less current liabilities | 7,793.00 | 7,114.00 | 7,510.00 | 6,855.00 | 7,937.00 |
| Total liabilities | -10,510.00 | -10,033.00 | -10,115.00 | -9,576.00 | -12,747.00 |
| Pension surplus/deficit (including prepayment) | – | -309.00 | 495.00 | -103.00 | -658.00 |
| Pension surplus/deficit (excluding prepayment) | – | – | – | – | – |
| Cash Flow | Interim (£m) | 2009 (£m) | 2008 (£m) | 2007 (£m) | 2006 (£m) |
| Fiscal year end | 03-Oct-09 | 21-Mar-09 | 22-Mar-08 | 24-Mar-07 | 25-Mar-06 |
| Duration (months) | 6.5 | 12 | 12 | 12 | 12 |
| Accounting format | IFRS | IFRS | IFRS | IFRS | IFRS |
| Cash Flows from Operating Activities | |||||
| Cash generated from operations | 359.00 | 1,206.00 | 998.00 | 830.00 | 780.00 |
| Interest paid | -65.00 | -128.00 | -123.00 | -95.00 | -159.00 |
| Income tax paid | -16.00 | -160.00 | -64.00 | – | 3.00 |
| Other inflow/outflow from operating activities | – | – | – | 9.00 | – |
| Net cash generated from operating activities | 278.00 | 918.00 | 811.00 | 744.00 | 624.00 |
| Cash Flows from Investing Activities | |||||
| Acquisition of subsidiary, net of cash acquired | – | -10.00 | -7.00 | -3.00 | -19.00 |
| Disposal of subsidiary, net of cash acquired | – | – | -1.00 | -13.00 | – |
| Net acquisitions, & disposals, net of cash required | – | -10.00 | -8.00 | -16.00 | -19.00 |
| Purchases of property, plant and equipment | -538.00 | -966.00 | -973.00 | -778.00 | -549.00 |
| Proceeds from sale of property, plant and equipment | 75.00 | 390.00 | 198.00 | 106.00 | 164.00 |
| Net cash from investments in property, plant & equipment | -463.00 | -576.00 | -775.00 | -672.00 | -385.00 |
| Purchases of intangible assets | -6.00 | -10.00 | -6.00 | -7.00 | -6.00 |
| Purchases of short term securities | – | – | – | – | – |
| Purchases of available for sale financial assets | -10.00 | -8.00 | – | – | – |
| Total purchases of investments | – | – | – | – | – |
| Proceeds from sale of available for sale financial assets | – | – | – | – | – |
| Proceeds from sale of investments in other companies | -2.00 | -291.00 | -31.00 | – | – |
| Total proceeds from sales of investments | -2.00 | -291.00 | -31.00 | – | – |
| Loans granted to related parties | – | – | – | – | – |
| Loan repayments received from related parties | – | – | – | – | – |
| Interest received | 9.00 | 13.00 | 29.00 | 15.00 | 6.00 |
| Dividends received | 2.00 | 3.00 | – | – | – |
| Other inflow/ outflow from investing activities | – | – | – | – | – |
| Net cash generated from investing activities | -470.00 | -879.00 | -791.00 | -680.00 | -404.00 |
| Cash Flows from Financing Activities | |||||
| Proceeds from borrowings | 235.00 | 195.00 | – | – | 2,115.00 |
| Repayments of borrowings | -59.00 | -33.00 | -36.00 | -75.00 | -2,050.00 |
| Dividends paid to company’s shareholders | -167.00 | -218.00 | -178.00 | -140.00 | -131.00 |
| Dividends paid to minority interests | – | – | – | – | – |
| Other inflow/ outflow from financing activities | 241.00 | 15.00 | 30.00 | 74.00 | -12.00 |
| Net cash generated from financing activities | 250.00 | -41.00 | -184.00 | -141.00 | -78.00 |
| Cash Flows for the Year | |||||
| Net increase in cash and bank overdrafts | 58.00 | -2.00 | -164.00 | -77.00 | 142.00 |
| Exchange gains and losses on cash and bank overdrafts | – | – | – | – | 0.00 |
| Net increase in cash for the year | 58.00 | -2.00 | -164.00 | -77.00 | 142.00 |
| Cash and bank overdrafts at beginning of period | 599.00 | 601.00 | 765.00 | 842.00 | 700.00 |
| Cash and bank overdrafts at end of period | 657.00 | 599.00 | 601.00 | 765.00 | 842.00 |